Table of contents
Overview
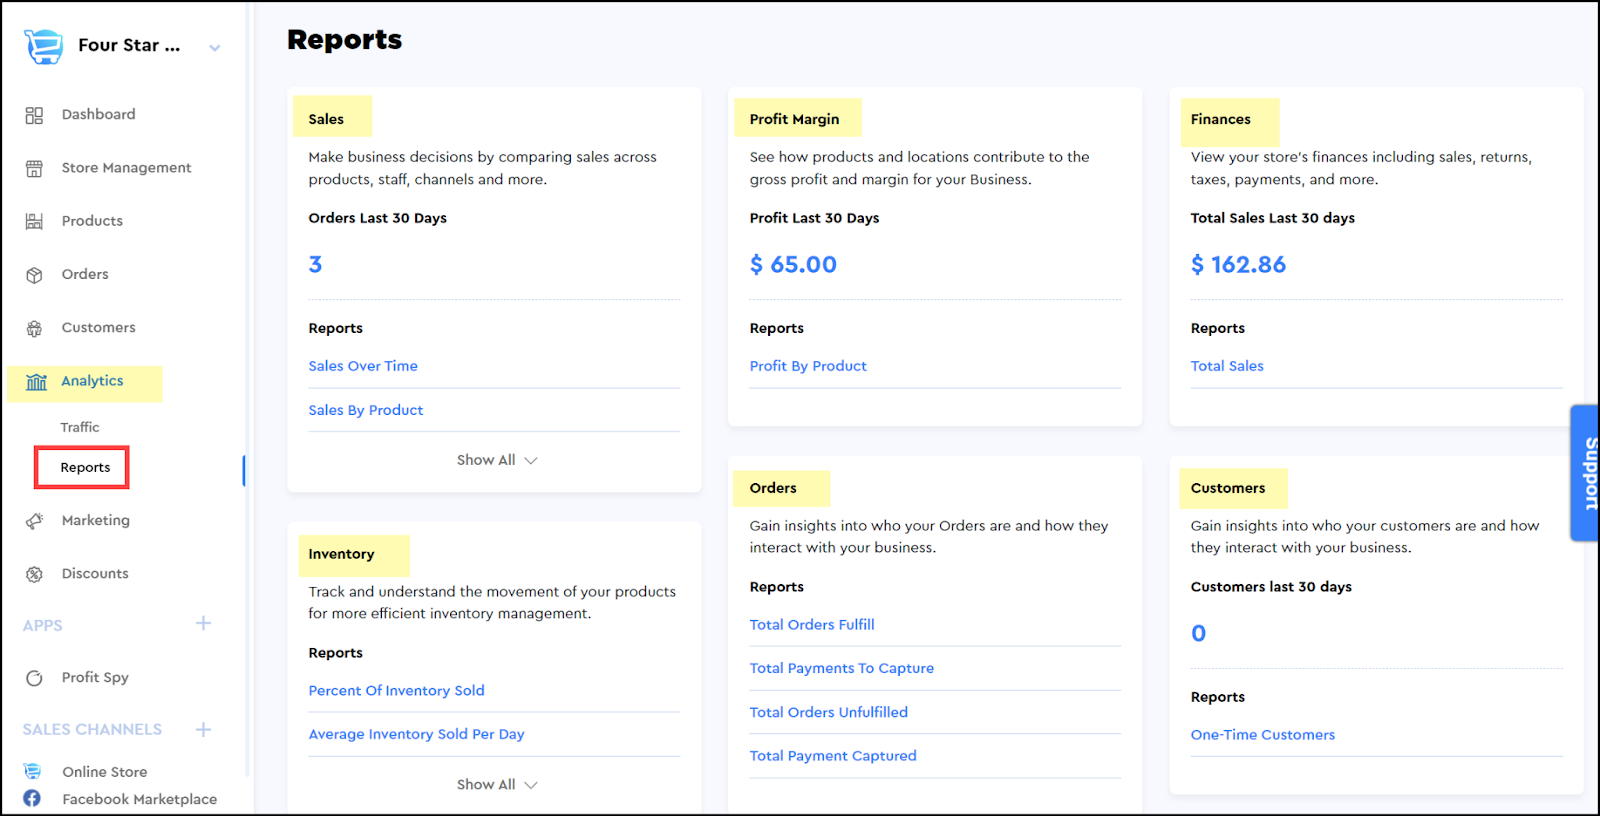
Reports are vital to bringing more business and identifying the areas that need improvements in your dropshipping business. Cartzy has a complete section dedicated to reports from where you can pull the latest reports on your store health, and look into the performance indicators to make better and informed decisions.
Path: Analytics > Reports
Various useful reports are available in Cartzy for the following modules:
1. Sales
3. Finances
4. Inventory
5. Orders
6. Customers
Whichever report you open in your Cartzy admin panel, the basic steps to view a report and to customize the report for a particular time period are the same as explained below.
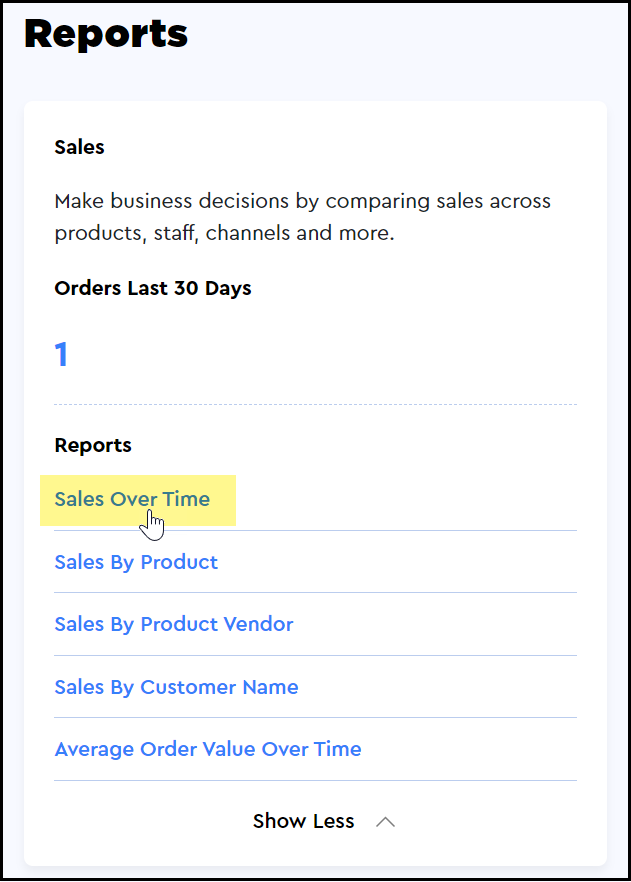
Viewing a report
To view any report, click on the report name, and the page will refresh to display that report. By default, the report is displayed for the time period of one month to date.
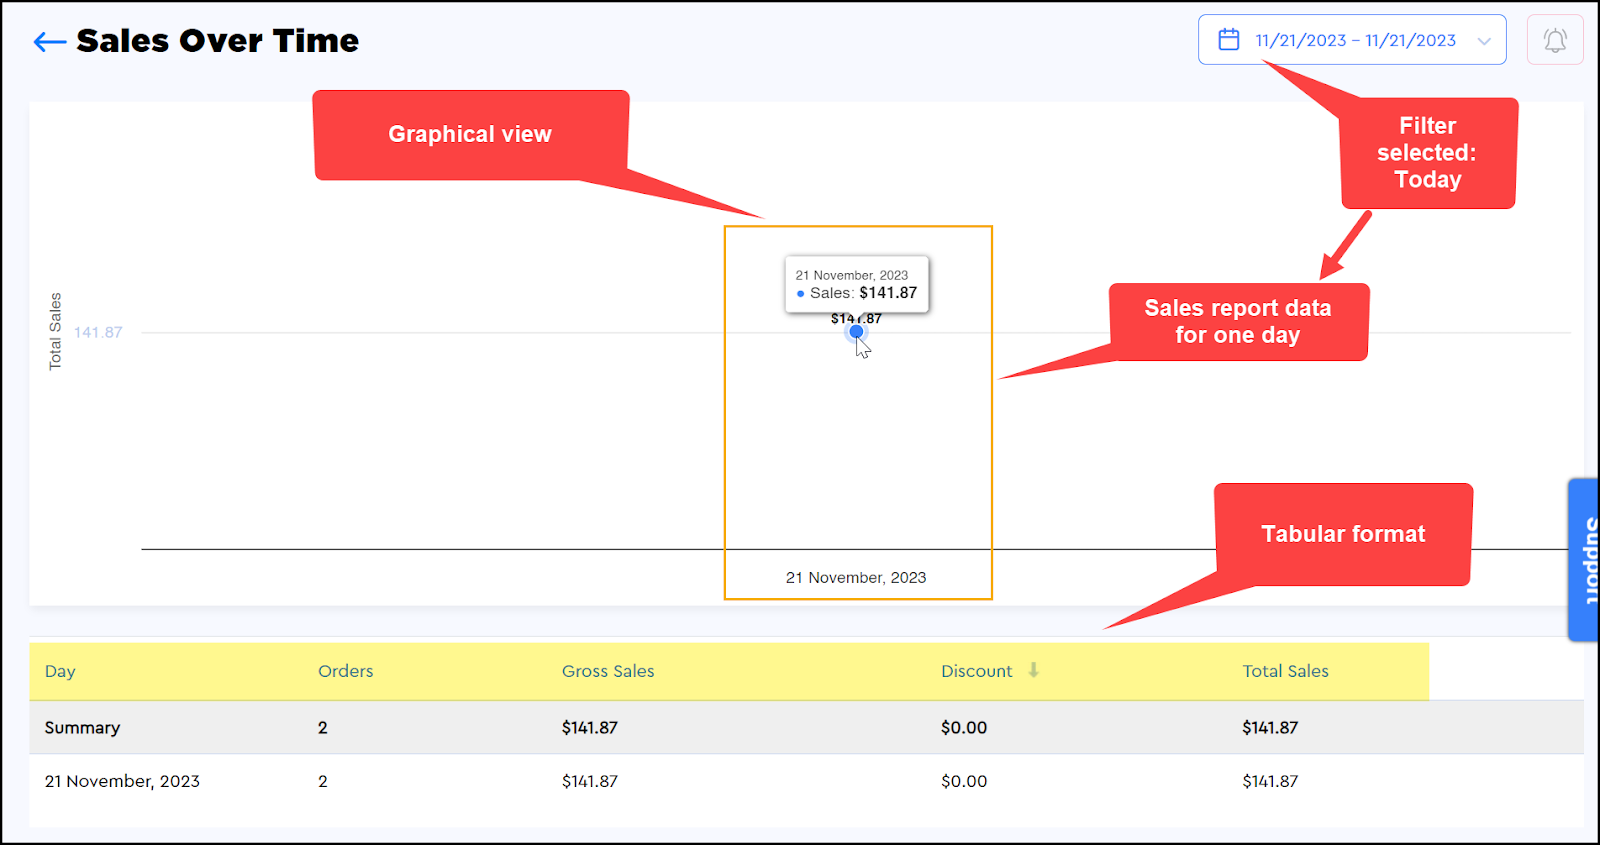
All reports are displayed in two formats:
1. Graphical display: In the graphical view, you can hover over any point to view the stats on a particular date.
2. Tabular form: The report data is listed in a tabular format, and is organized by the date and other attributes. One such example is shared below.
👉 The top row of the table always displays the summary of the report i.e., total figures.
The date filter for reports
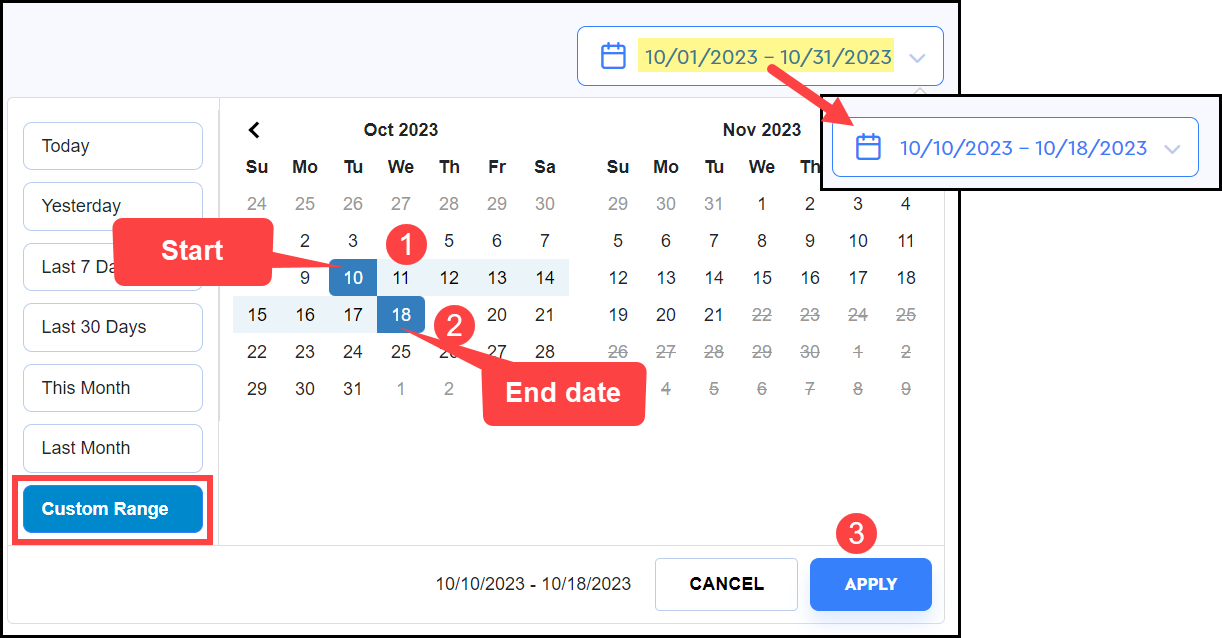
To view the report for a custom time period, you can use the calendar filter given at the top right corner of the page. Now, the calendar allows you to filter your report data based on the following filters:
1. Pre-set filters
2. Custom date range
1. Pre-set filters: You can use the pre-defined date filters such as Today, Yesterday, last 7 days, etc. to view the report data for those days.
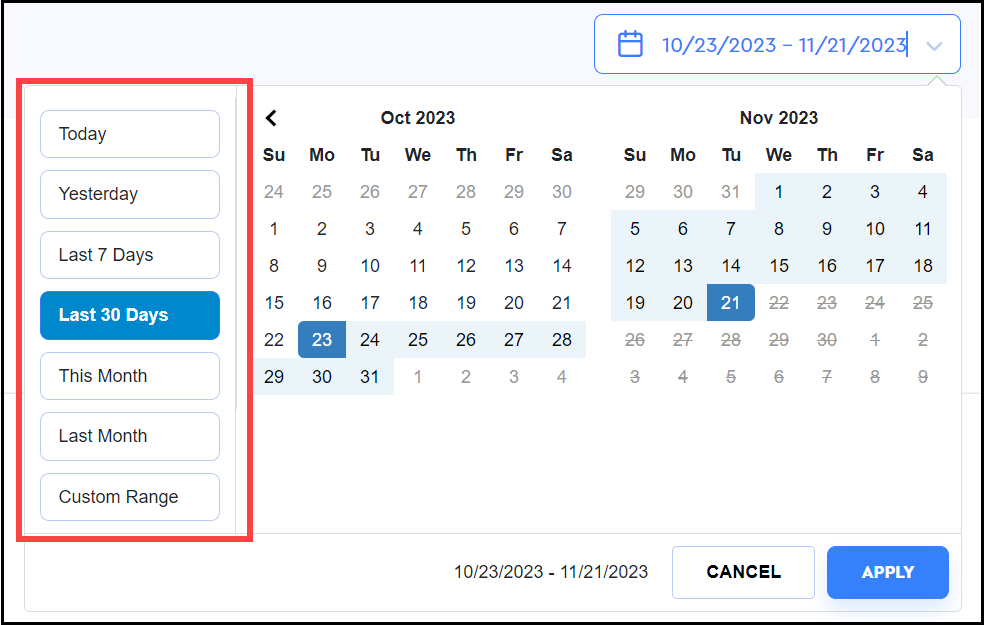
2. Custom date range: To extract a report for a self-defined time period,
i. First, select the start and the end dates to define your time period to view the data. (At this point, the Custom Range option will be selected automatically)
ii. Now, click the Apply button.
👉As soon as you click the Apply button, the dashboard will refresh automatically to pull the desired stats against the selected date filters. The selected date range will also appear next to the calendar icon in the top right corner of the page.