
Table of contents
Inventory reports are like the superheroes of e-commerce! They can help you keep the right amount of products in stock, avoid running out, and save money. These reports also make sure your customers are happy by ensuring you have what they want. If used appropriately, these reports can be secret weapons for making smart decisions and keeping your online store running smoothly!
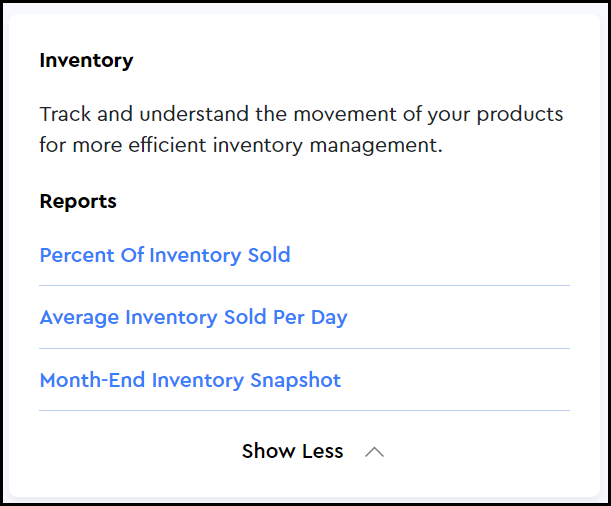
Under the Inventory section on the Reports page, you can view the reports of your inventory for different attributes.
Path: Analytics > Reports > Inventory
The following types of reports are available:
1. Percent of inventory sold
2. Average inventory sold per day
3. Month-end inventory snapshot
Let’s explore each of these, one by one.
Percent of inventory sold
The "Percent of Inventory Sold" report provides a valuable perspective on the efficiency of your inventory management and sales performance. It enables you to make informed decisions to ensure that your inventory levels align with customer demand, ultimately contributing to the overall success of your online store.
Here's a breakdown of each stat that is pulled for the report:
1. Product Title: It identifies the name or title of the product.
-
- Usefulness: Helps you understand which specific products are being analyzed in the report.
2. Variant: Specifies the variant of the product (e.g., size, color).
-
- Usefulness: Allows you to see how different versions of the same product are performing.
3. Variant SKU: SKU (Stock Keeping Unit) is a unique identifier for each variant.
-
- Usefulness: Provides a distinct reference for tracking and managing inventory.
4. Quantity Sold: It is the total number of units of a specific product variant that have been sold.
-
- Usefulness: Indicates the popularity and demand for a particular product variant.
5. Starting Quantity: It is the initial quantity of a specific product variant in your inventory.
-
- Usefulness: Provides the baseline inventory level before sales occurred.
6. Percent Sold:
-
- Calculation: (Quantity Sold / Starting Quantity) * 100
- Significance: The percentage of the starting inventory that has been sold.
- Usefulness: Indicates the efficiency of inventory turnover and helps identify fast-moving or slow-moving products.

Insights from the Report
-
High Percent Sold:
- Implications: Indicates strong demand and efficient turnover.
- Action: Consider restocking or promoting the product further.
-
Low Percent Sold:
- Implications: Suggests slower-moving inventory.
- Action: Evaluate marketing strategies, consider discounts, or assess whether adjustments to the product variant are needed.
Strategic Considerations
- Product Performance: Identify top-performing products and variants.
- Inventory Management: Optimize stock levels based on demand.
- Marketing Strategy: Tailor marketing efforts for different products and variants.
In short, this report helps you understand the sales performance and efficiency of your inventory turnover for specific products and their variants. It's a valuable tool for making informed decisions about restocking, promotions, and overall inventory management in your Cartzy store.
Average inventory sold per day
The "Average Inventory Sold Per Day" report in Cartzy provides valuable insights into the rate at which specific products and variants are being sold over a given period. Here's a breakdown of each stat in the report:
1. Product Title: Identifies the name or title of the product.
-
- Usefulness: Helps you understand which specific products are being analyzed in the report.
2. Variant Title: Specifies the variant of the product (e.g., size, color).
-
- Usefulness: Allows you to see how different versions of the same product are performing.
3. Variant SKU: Significance: SKU (Stock Keeping Unit) is a unique identifier for each variant.
-
- Usefulness: Provides a distinct reference for tracking and managing inventory.
4. Quantity Sold: It is the total number of units of a specific product variant that have been sold.
-
- Usefulness: Indicates the popularity and demand for a particular product variant.
5. Ending Quantity: It is the remaining quantity of a specific product variant in your inventory after the specified period.
-
- Usefulness: Shows the current stock level at the end of the analyzed period.
6. Quantity Sold Per Day:
-
- Calculation: Quantity Sold / Number of Days in the Period
- Significance: The average number of units sold per day for a specific product variant.
- Usefulness: Provides a daily sales rate, helping you understand the product's popularity and sales velocity.

Insights from the Report
-
High Quantity Sold Per Day:
- Implications: Indicates a product or variant with strong daily demand.
- Action: Consider strategies to maintain or capitalize on this popularity.
-
Low Quantity Sold Per Day:
- Implications: It suggests slower daily sales for a particular product or variant.
- Action: Evaluate marketing strategies, consider promotions, or assess the need for adjustments.
Strategic Considerations
- Daily Sales Velocity: Understand how quickly specific products are selling daily.
- Inventory Management: Adjust stock levels based on daily sales rates.
- Marketing Strategy: Tailor promotions or marketing efforts for products with varying daily sales rates.
In short, the "Average Inventory Sold Per Day" report provides a focused view of the daily sales performance for specific products and their variants. This information is crucial for making informed decisions about inventory management, marketing strategies, and the overall product performance of your Cartzy store.
Month-end inventory snapshot
The "Month-End Inventory Snapshot” report in your Cartzy store provides a point-in-time overview of the remaining stock levels for each product variant at the end of a specific month. Here's a breakdown of each stat in your report:
1. Product Title: Identifies the name or title of the product.
-
- Usefulness: This helps you quickly understand which specific products are being analyzed in the report.
2. Variant Title: Specifies the variant of the product (e.g., size, color).
-
- Usefulness: Allows you to see how different versions of the same product are performing.
3. Variant SKU: SKU (Stock Keeping Unit) is a unique identifier for each variant.
-
- Usefulness: Provides a distinct reference for tracking and managing inventory.
4. Ending Quantity: The remaining quantity of a specific product variant in your inventory at the end of the specified month.
-
- Usefulness: Indicates the stock level of each product variant at end of the month.

Insights from the Report
-
Low Ending Quantity:
- Implications: It suggests lower stock levels for a specific product or variant.
- Action: Consider restocking strategies or assess the need for adjustments.
-
High Ending Quantity:
- Implications: Indicates a surplus of stock for a particular product or variant.
- Action: Evaluate sales performance, consider promotions, or manage excess inventory.
Strategic Considerations
- Inventory Planning: Assess the month-end stock levels to inform future inventory planning.
- Stock Replenishment: Identify products or variants that may need replenishment.
- Product Performance: Understand how well products are managing inventory over time.
In short, the "Month-End Inventory Snapshot” report provides a snapshot of the remaining stock levels for each product variant at the end of a specific month. This information is valuable for making strategic decisions related to inventory management, restocking, and assessing the overall performance of products in your Cartzy store.