Table of contents
- Sales Over Time
- Sales By Product
- Sales By Product Vendor
- Sales By Customer Name
- Average Order Value Over Time
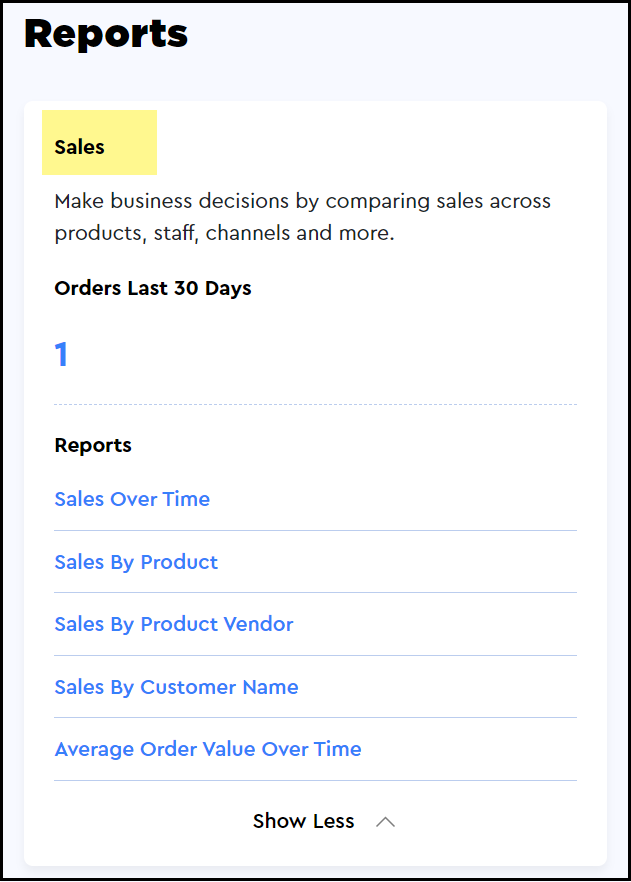
Under this section, you can view the sales report for a specific sales attribute separately. Therefore, the following types of reports are available:
1. Sales over time
2. Sales by product
3. Sales By Product Vendor
4. Sales By Customer Name
5. Average Order Value Over Time
Let’s explore each of these, one by one.
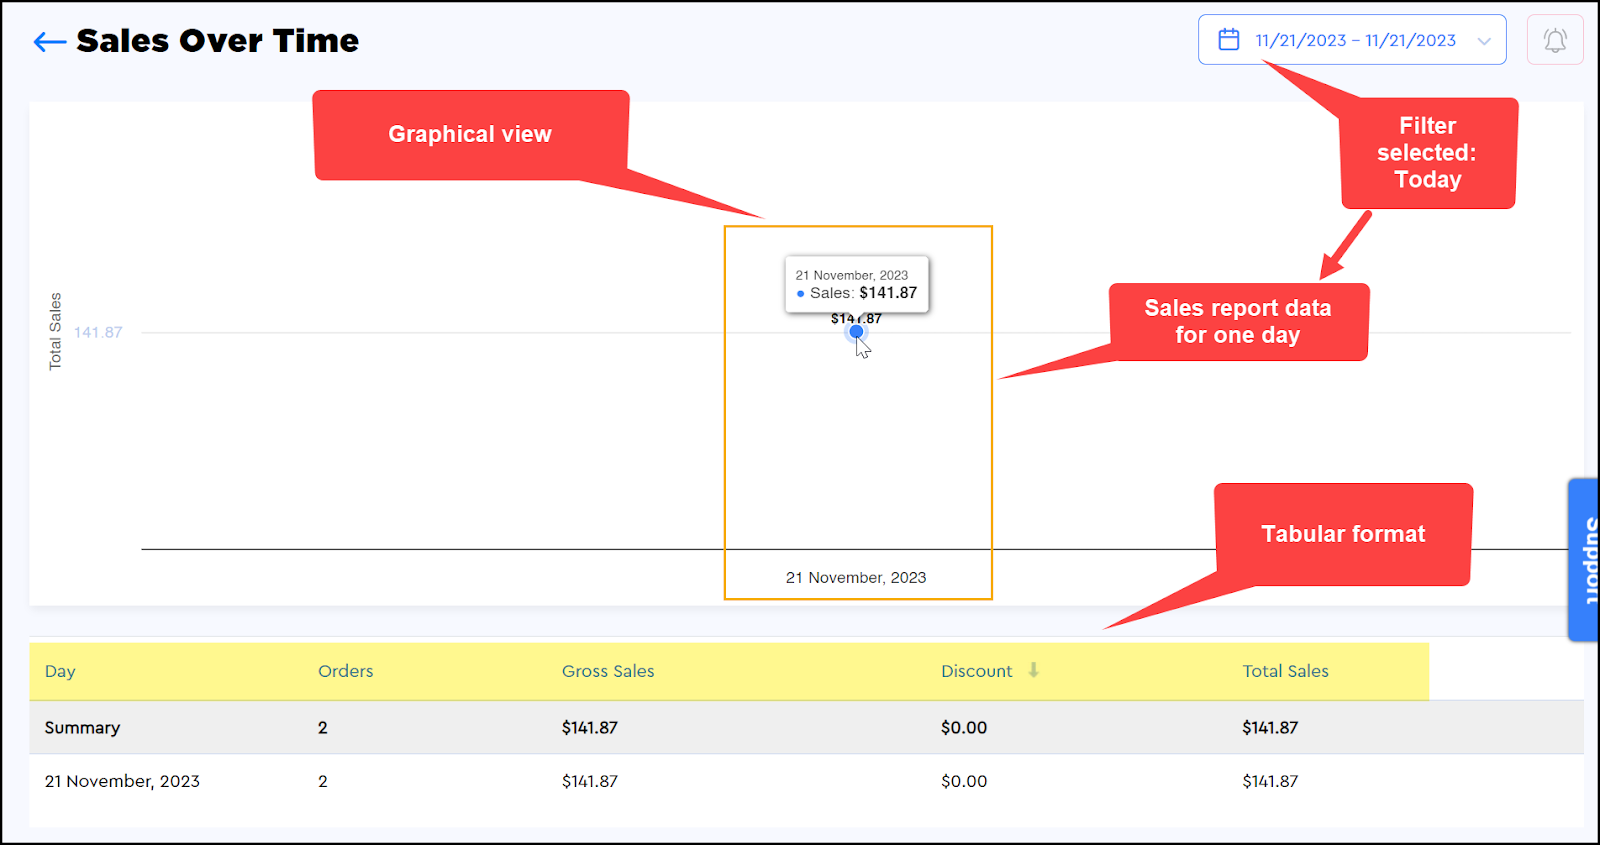
Sales Over Time
This report reflects the total sales that your store has made in a specific time period. The time period is selected using the date filter as explained above.
The report data is listed with the following attributes:
1. Day: This column displays the date. For example, if you extracted the report for the last 7 days, then each day(date) will be listed here if there were sales on that day.
2. Orders: It reflects the total number of orders against the date.
3. Gross Sales: It reflects the actual order value (without discounts) of all the sales that were made on that day.
4. Discount: It displays the total discount on all the sales that were made on that day.
5. Total Sales: It reflects the discounted order value of the total sales that were made on that day.
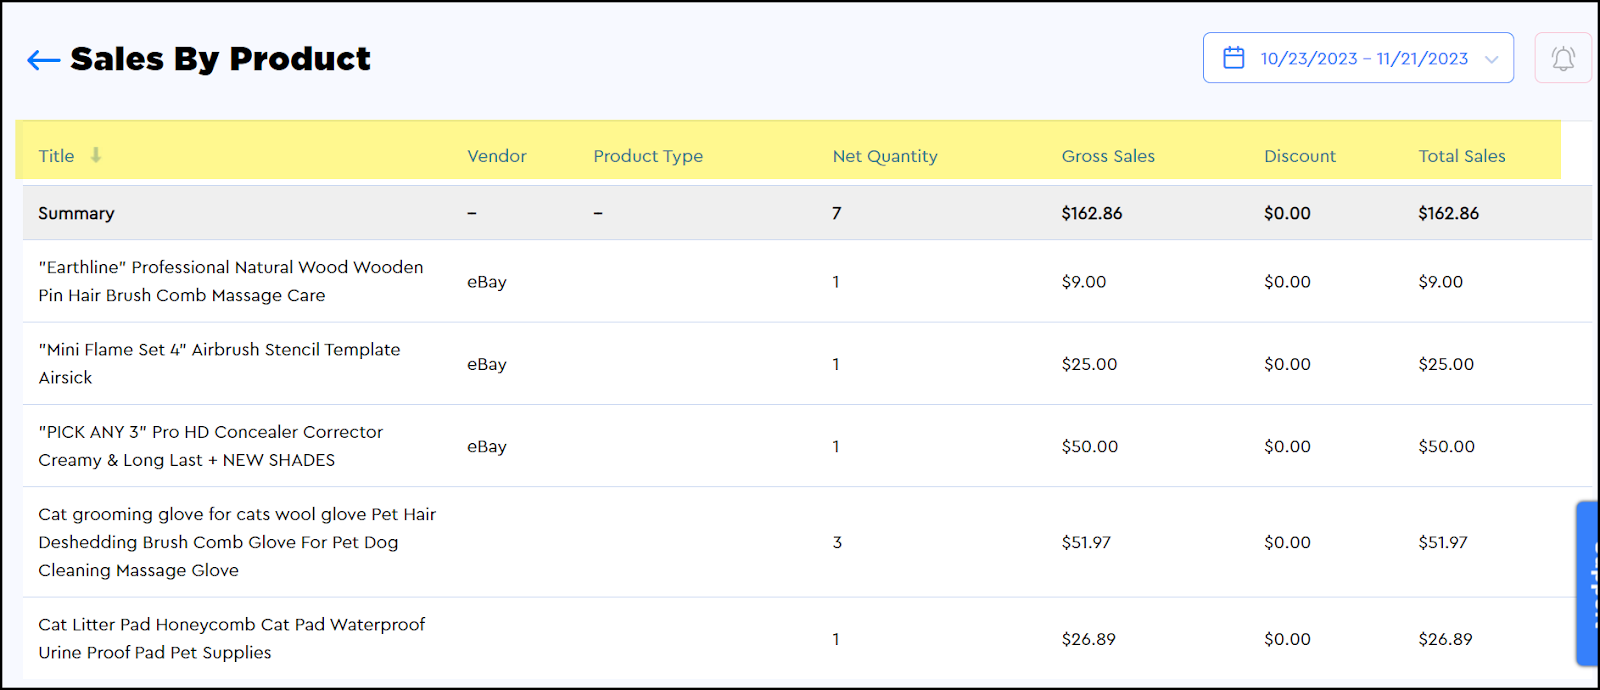
Sales By Product
This report categorizes the sales based on each product. For example, if you want to know how many sales were made for a particular product, you can use this report. You can use the date filters to view the sales of a specific product in a specific time period. This also helps you identify the product that is performing well on your store. For example, during the Christmas holidays or sales season, Christmas caps might be a 🔥 hot-selling item on your store.
👉There is no graphical display for this report.
Since the data is organized by the product sold, the following attributes are displayed in the table.
1. Title: It’s the name of the product against which the sale was made in the selected time period.
2. Vendor: Name of the vendor of the product sold.
3. Product Type: Identifies the type of product.
4. Net Quantity: Total quantity of the products sold. The summary shows the total of all the products irrespective of the product type. However, each separate record shows the total of each product type that was sold.
5. Gross Sales: This displays the actual price of the product that was sold. The summary row displays the total price of all the products sold during the selected time period.
6. Discount: Here, you can see the discount if that was offered on a product.
7. Total Sales: This shows the total discounted price of each product. It reflects how many sales you have made against that product in the selected time period. The summary row shows the total sale value of all the products (for the selected time period) irrespective of the product type.
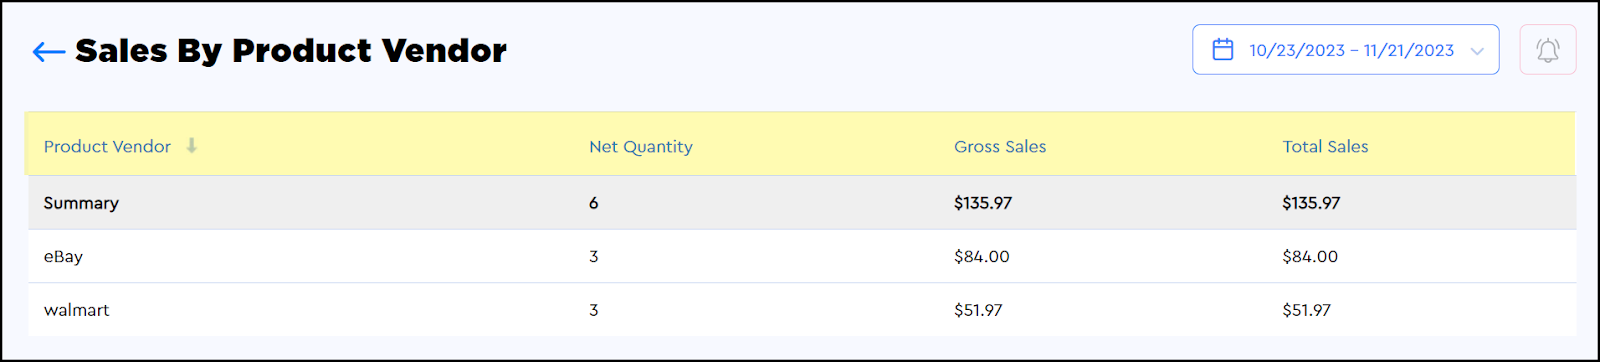
Sales By Product Vendor
This report categorizes the sales based on product vendors. For example, if you want to know the sale made against a particular vendor in a particular time period, then you can use this report.
This report also helps you identify the product vendor who is popular on your store.
👉There is no graphical display for this report.
Since the data is organized by the product vendor, the following attributes are displayed in the table.
1. Product vendor: This column reflects the name of the product vendor.
2. Net quantity: It reflects the total number of the vendor’s products that were sold during the selected time period.
3. Gross sales: This shows the actual sales (without discounts) that were made against the vendor’s products on your store during the selected time period.
4. Total sales: This shows the total sales value (inclusive of discounts) that were made against the vendor’s products on your store during the selected time period.
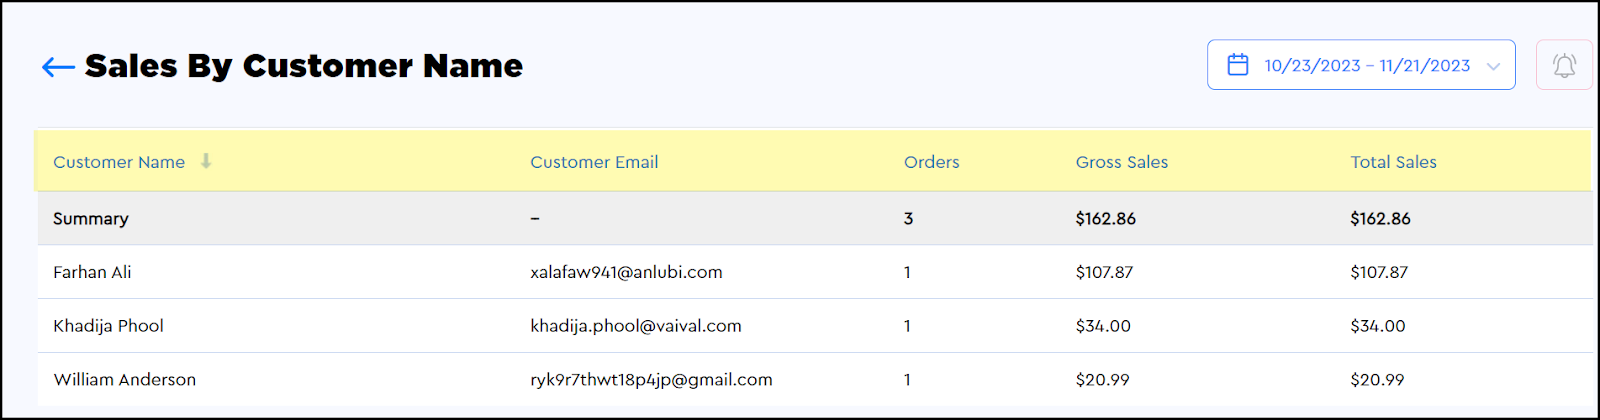
Sales By Customer Name
This report categorizes the sales based on customers. For example, if you want to see the sales value generated against the orders of a particular customer during a particular time period, then you can use this report.
💡This report also helps you identify the loyal customers of your store. The higher the number of orders, the more loyal is the customer.
👉There is no graphical display for this report.
Since the data is organized by the customer records, the following attributes are displayed in the table.
1. Customer name: This column reflects the name of the customer who placed the order(s) on your store.
2. Customer email: It reflects the email id of the customer.
3. Orders: This shows the total number of orders that were placed by the customer on your store. Only the fulfilled and completed orders will be counted here.
4. Gross sales: This shows the actual sales (without discounts) that were made against the customer’s order(s) placed on your store during the selected time period.
5. Total sales: This shows the total sales value (inclusive of discounts) that were made against the customer’s order(s) on your store during the selected time period.
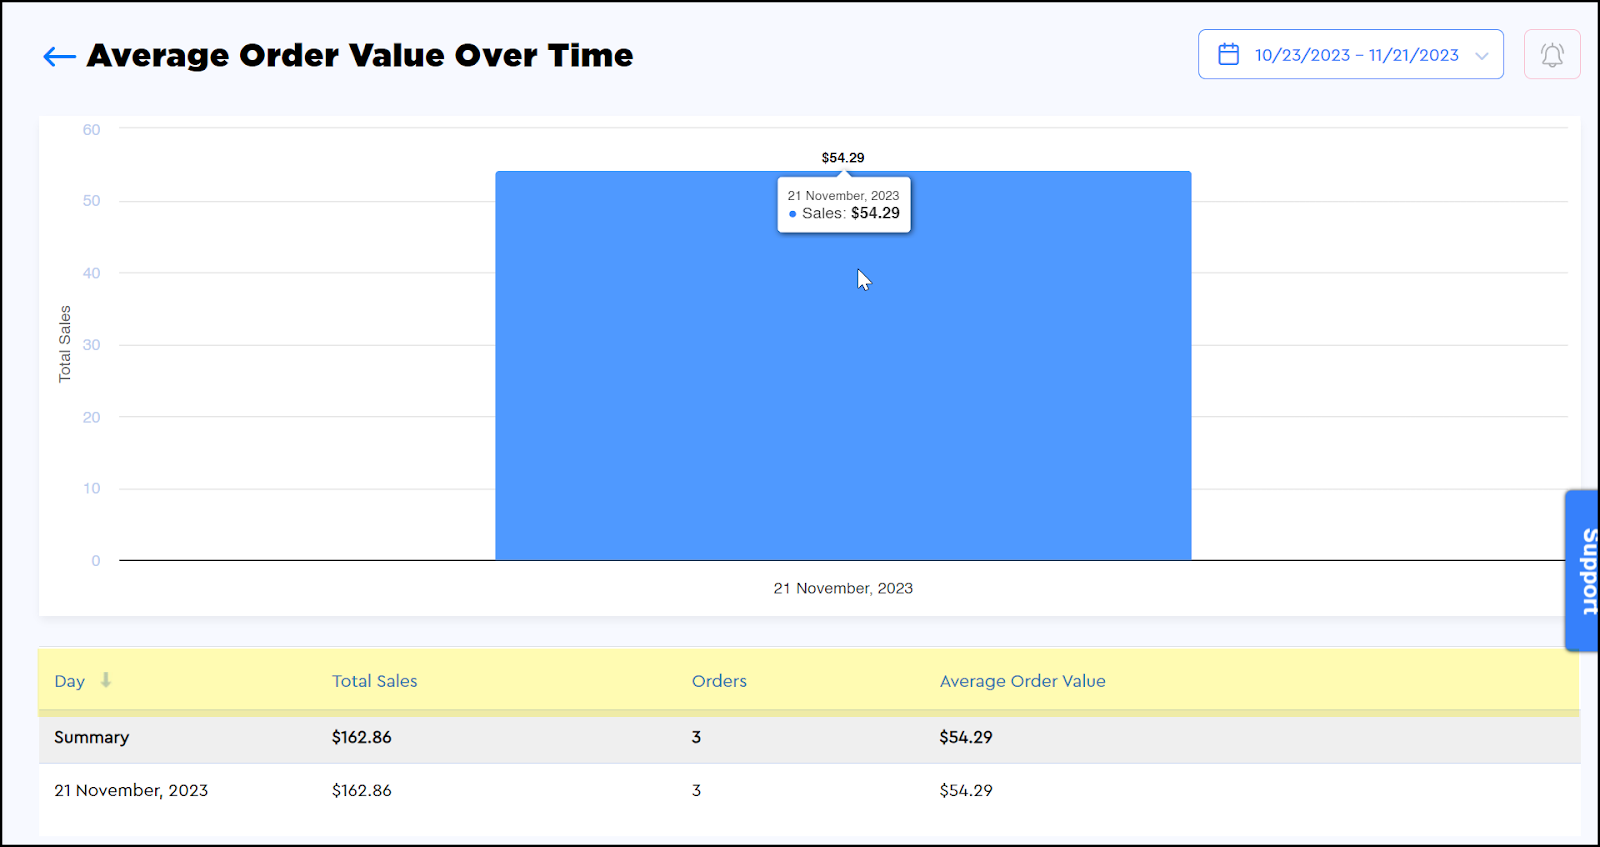
Average Order Value Over Time
This report helps you get an insight into the average order value per day.
You can customize the date range using the calendar filter given at the top right corner of the page. For example, if you pull the report of the last 7 days, the data will be displayed for the last 7 days (with dates).
You can view it in graphical format as well as in tabular format.
The table lists the following data against each day of the selected time period.
1. Total sales: The total sales value (inclusive of discounts) generated on a particular date(day).
2. Orders: The total number of orders placed on that particular day against which the average order value is calculated.
3. Average order value: The average order value for a particular day is calculated from the total sales and total number of orders for the day.