Table of contents
Welcome to the heart of Cartzy: The Dashboard. This offers a seamless experience, allowing users to effortlessly view the store setup progress, monitor orders and revenues, and get useful insights about the store traffic against a specific period.
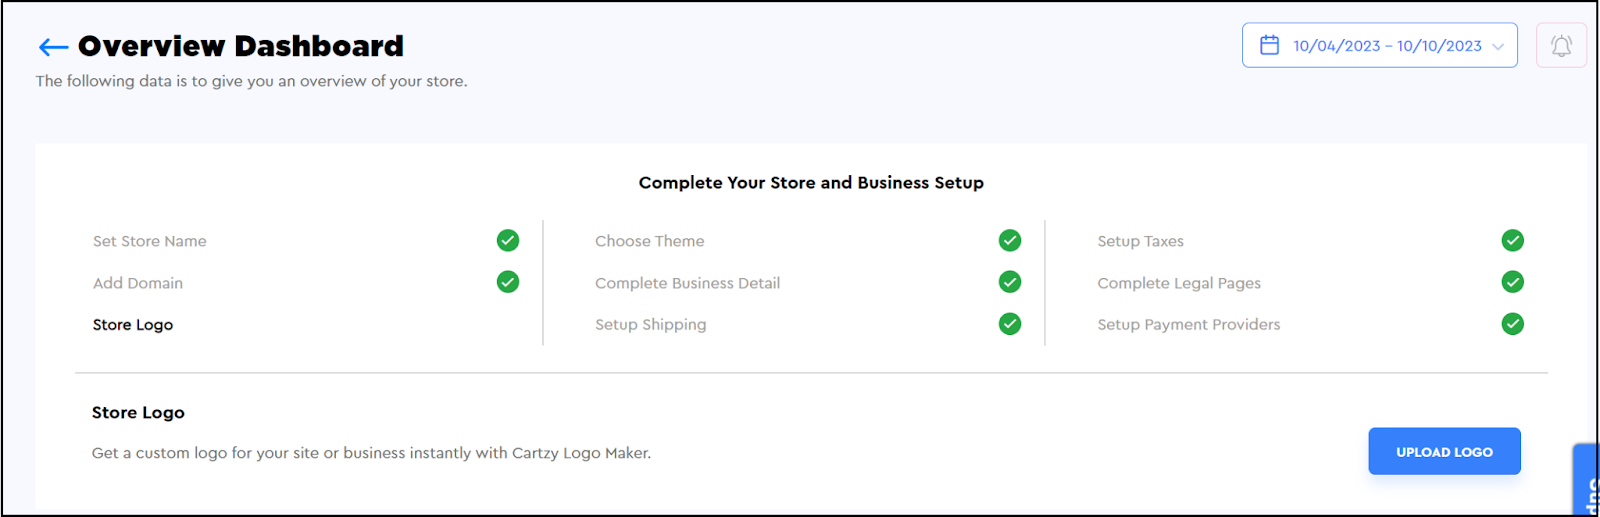
Store Setup Progress
The Cartzy dashboard does not just give you an overview of your store sales, and website traffic, but it also enables you to track the progress of your store setup. An item will be checkmarked if completed.
The completion status of the following items can be tracked on the dashboard. These are the basic elements that you need to configure to set up your store and keep it running.
1. Store name: You can add your store name at the path: Settings > General Settings
2. Store domain: Learn how to add a domin to your store.
3. Store logo: Learn how to setup the logo of your store.
4. Store theme: Click here to see how you can customize your store theme.
5. Business detail: You can add the information about your business address, and operational days/hours at the path: Settings > General Settings
6. Shipping profile: Add and customize multiple shipping profiles to your Cartzy store. Learn more about shipping and delivery.
7. Tax collection setup: You need to configure tax collection rates against the shipping profiles for the regions your store will be delivering orders. Learn more about tax collection configuration in Cartzy.
Learn more about tax collection configuration in Cartzy.
8. Legal pages’ content: You need to add legal pages’ content on your website to inform your customers about your business policies regarding refunds, returns, and cancellations. You can customize the legal pages' content at the path: Settings > Legal Pages.
9. Payment providers setup: To run a drop shipping business online, integrating a reliable payment processing gateway is one of the fundamental requirements! Cartzy enables you to integrate your Stripe and PayPal accounts for payment processing.
Store performance reports
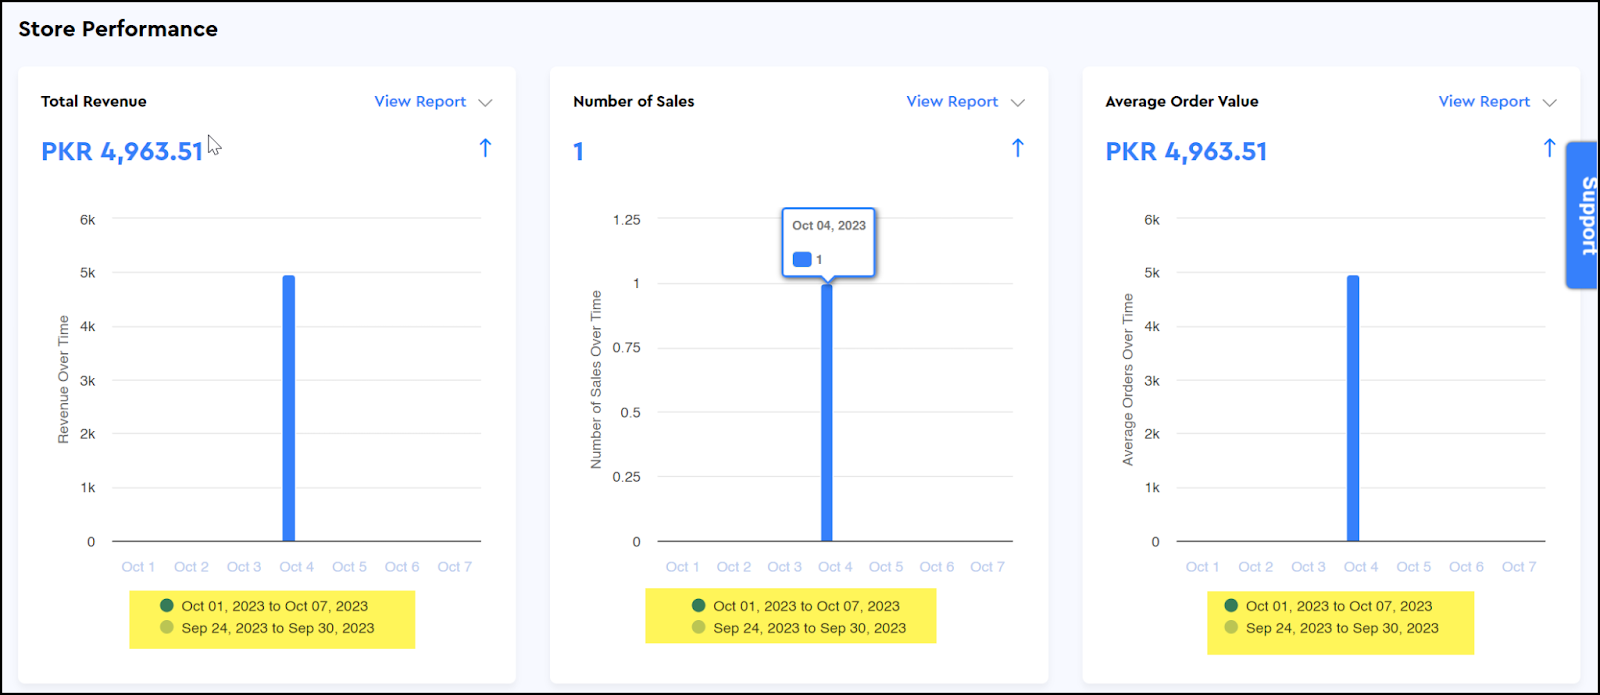
Having store performance reports wizards on your dashboard can save you a lot of time that you would otherwise spend running the reports under the Analytics section. It pulls the same reports but displays the most important reports in the form of charts as shown in the image below.
❗By default, all the reports on the dashboard display the stats for the one week from the current date. However, you can set a custom date range to see the data for the desired period as explained later in this article.
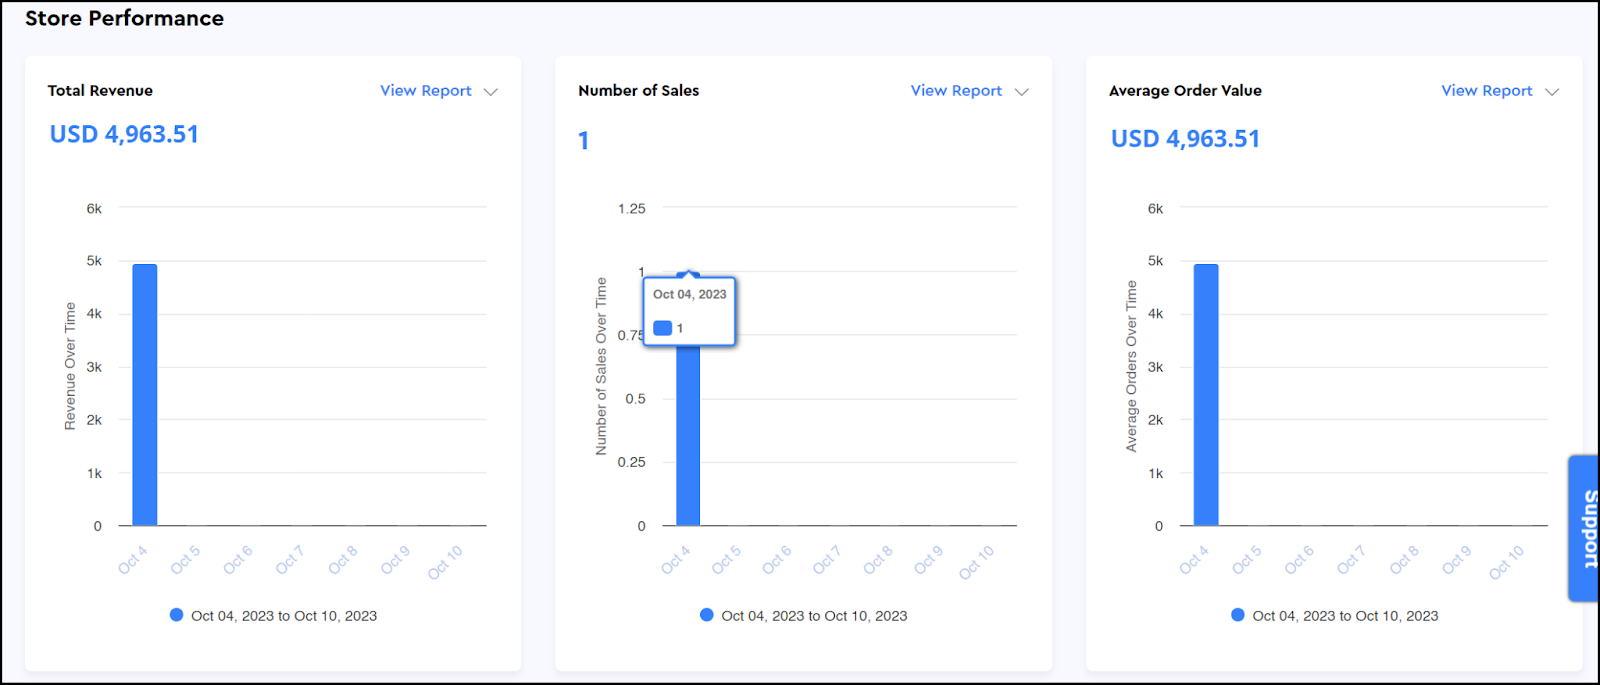
The following bar chart reports are at your disposal on the Cartzy dashboard.
1. Total revenue: It displays the total revenue generated on your store during the selected time period.
2. Number of sales: It displays the total number of sales made in your store during the selected time period.
3. Average order value: It displays the average amount (price) against the total orders placed in your store during the selected time period.
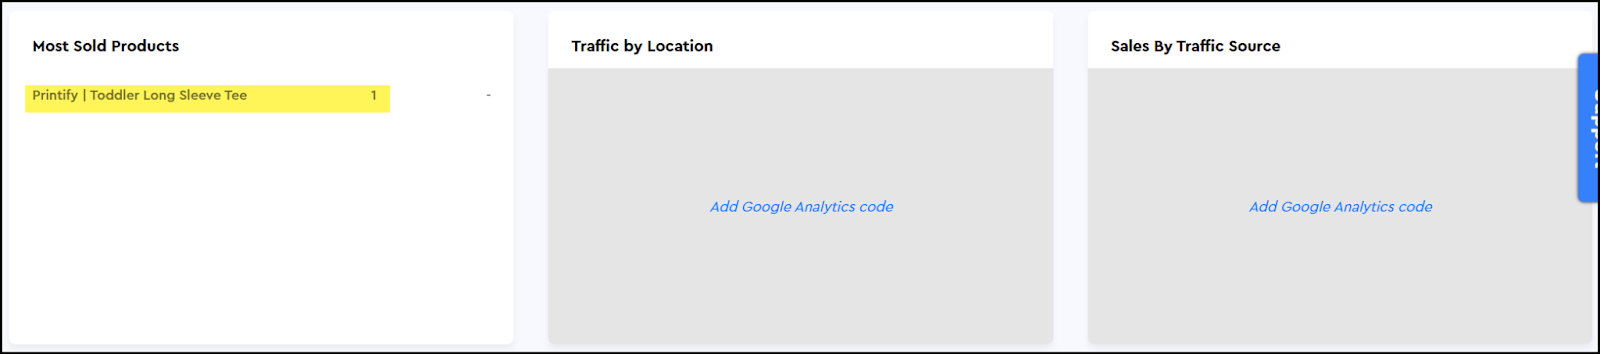
4. Most sold products: It lists the products that were sold frequently in your store during the selected time period.
5. Traffic by location: It extracts the demographic information about your website visitors through your Google Analytics account that is integrated with your store. Therefore, to get insights about your store traffic by region, you need to connect your Google Analytics account with your Cartzy store.
6. Sales by traffic source: It extracts the information about the sales made on your store by your website visitors through your Google Analytics account. To get insights about your store sales by region, you need to connect your Google Analytics account with your Cartzy store.
Total Orders
This section gives a summary of the orders placed in your store during the selected time period. The orders are listed by order number, date of the order placement, name of the customer, total times in the order, and the total amount of the order.
Each tab displays the order records with a specific status. Click on the View All Records link will take you to the relevant report that is also accessible at the path: Analytics > Reports.
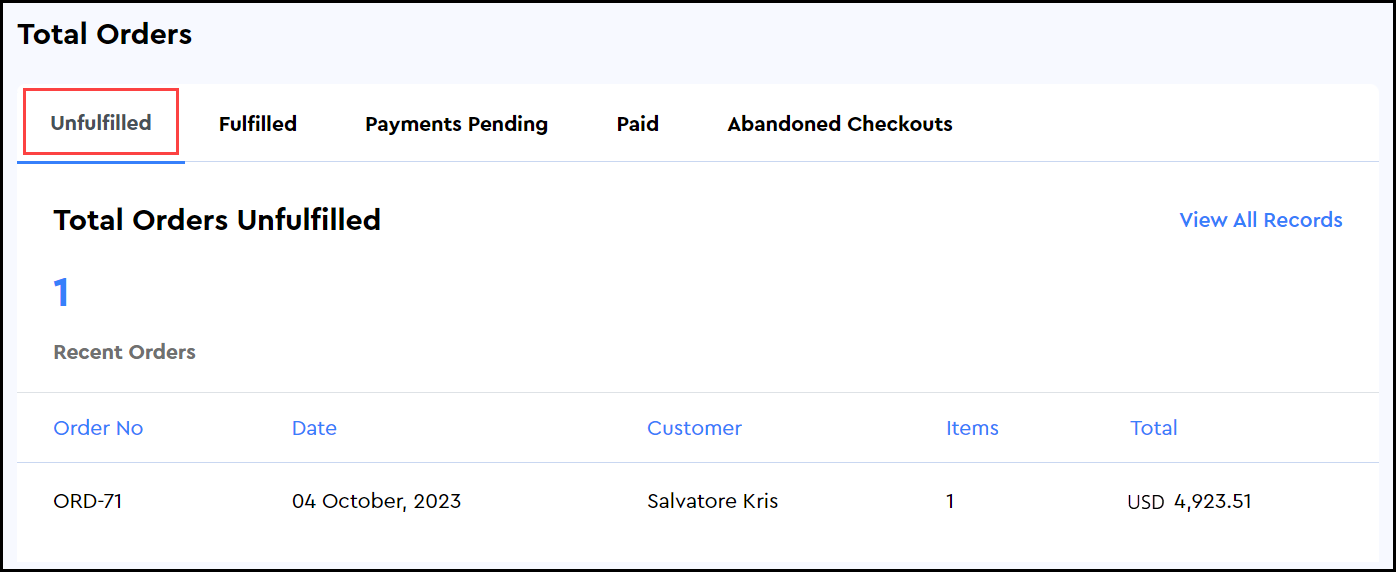
Unfulfilled
On this tab, all the orders that were unfulfilled during the selected time period will be listed.
View All Records: It will take you to the report “Total Orders Unfulfilled.”
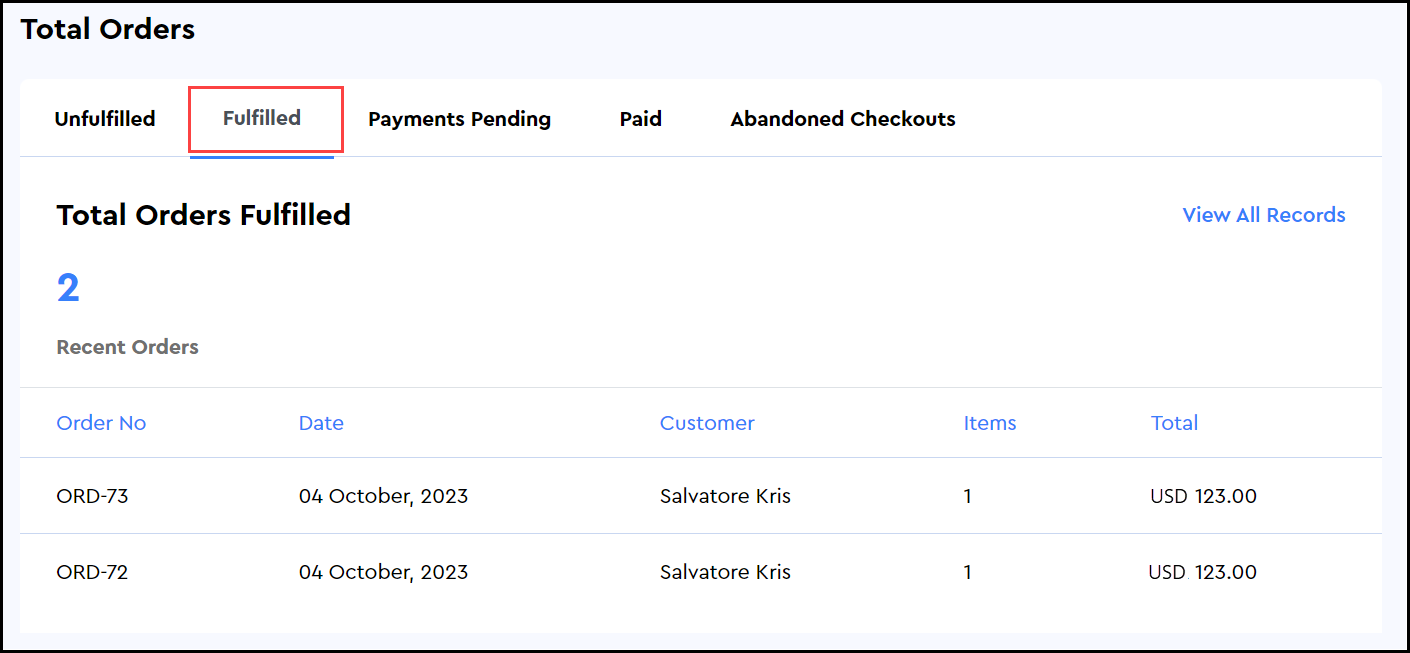
Fulfilled
On this tab, all the orders that were fulfilled successfully during the selected time period will be listed.
View All Records: It will take you to the report “Total Orders Fulfilled.”
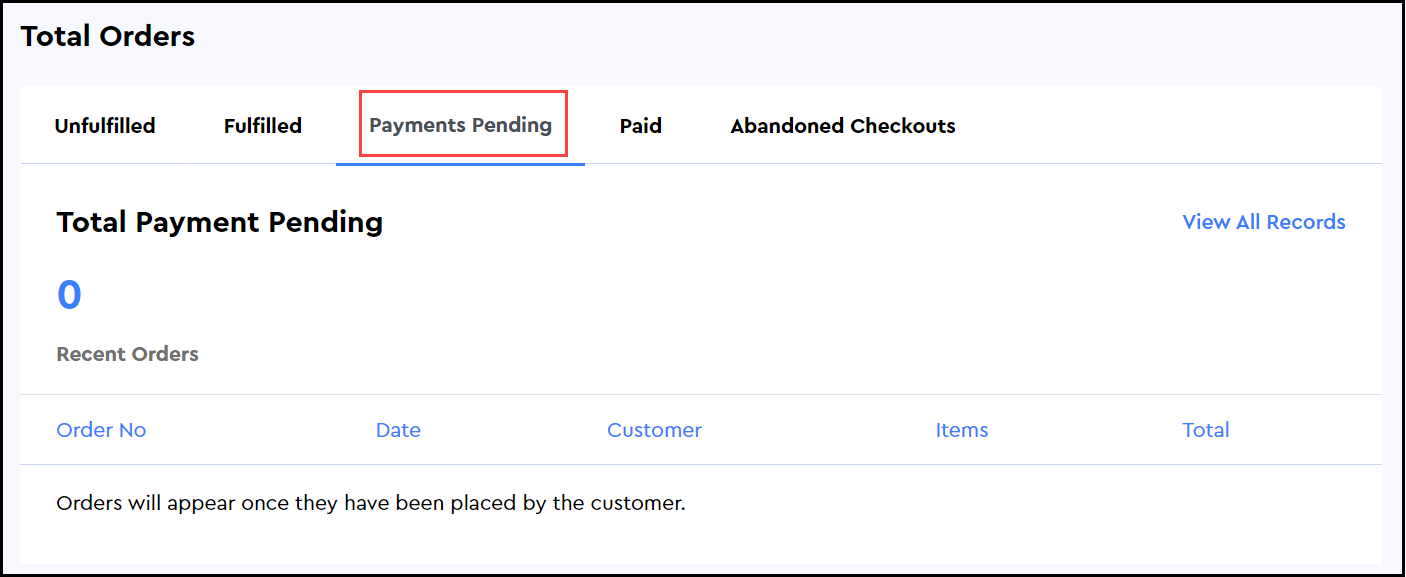
Payments Pending
On this tab, all the orders against which the payment was pending during the selected time period will be listed.
View All Records: It will take you to the report “Total Payments To Capture.”
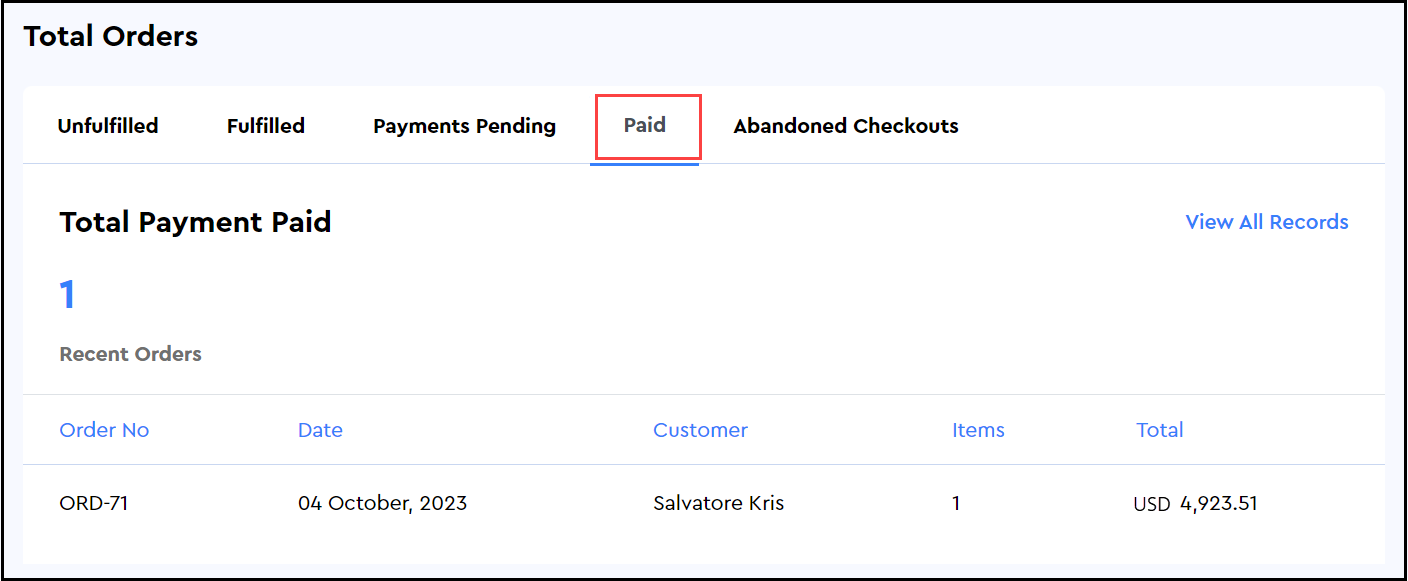
Paid
On this tab, the fully paid orders during the selected time period will be listed.
View All Records: It will take you to the report “Total Payments Captured.”
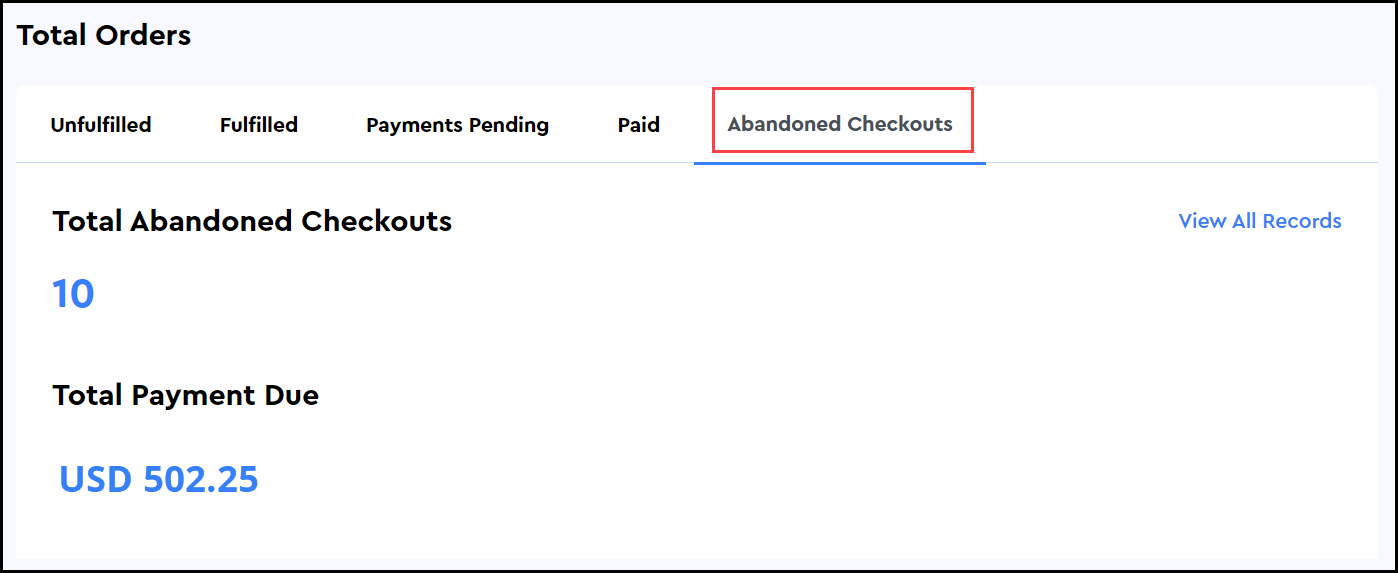
Abandoned Checkouts
On this tab, you can see the total number of abandoned carts/uncompleted orders during the selected time period. The total value of those orders will also be displayed.
View All Records: It will take you to the report “Abandoned Cart Recovery.”
Customizing dates for reports
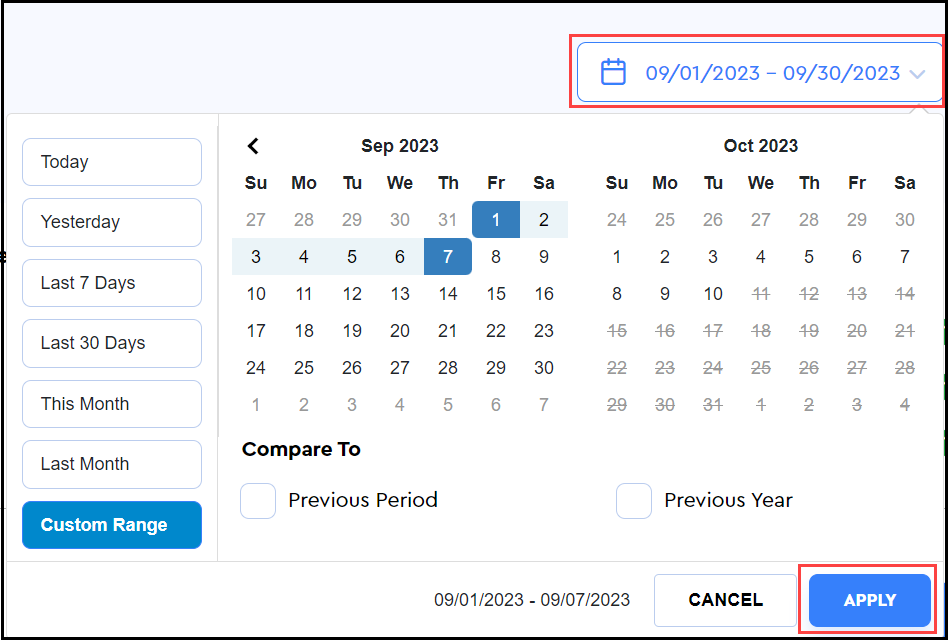
To filter the data/reports during a specific time period, you need to define the date range using the drop-down calendar option given at the top right corner of the page.
- Pre-set filters: You can use the pre-defined date filters such as Today, Yesterday, last 7 days, etc. to view the data or your store health in those days.
- Custom date range: To view your store health during a self-defined time period, first click on the Custom Range option. Then, select the start and the end dates to define your time period to view the data.
As soon as you click the Apply button, the dashboard will refresh automatically to pull the desired stats against the selected date filters.
-
Comparison: While defining the date for the reports, you can also select one of the following options to see the comparison of the data for the selected period against one of the following options.
-
Previous Period: It will show you the data of the currently selected period in comparison with the previous period. For example, if you selected a week, then the comparison period would be the past week according to the defined dates. Please take a look at the image shared below for a demonstration of this example.
-
Previous Year: It will show you the data of the current period compared to the previous year.
-